While there have been a significant number of colleges that have gone back to test-required admissions or announced that they will (all of the Ivy League, University of Texas at Austin, MIT, Caltech, Ohio State, University of Georgia, University of Tennessee, Vanderbilt, University of Miami, and more), a majority of colleges are still test-optional. For the colleges that require scores outright, and when the returning ones first said so, see which colleges require the SAT® or ACT®.
Optional, sometimes
However, even when they remain test-optional, just how “optional” test scores are varies. At least 86 of the top 100 colleges have publicly provided updated Common Data Set information for the last admissions cycle (2025-2026). Of the 86 in the table below, 53% became less test-optional (they either increased the percentage of their enrolled students who submitted test scores or became entirely test-required); 17% became more test-optional (they decreased the percentage of those enrolled who submitted test scores); and roughly 28% retained their earlier policies (13% remained test-blind, 7% were already test-required, and 8% kept the same percentage of submitters).
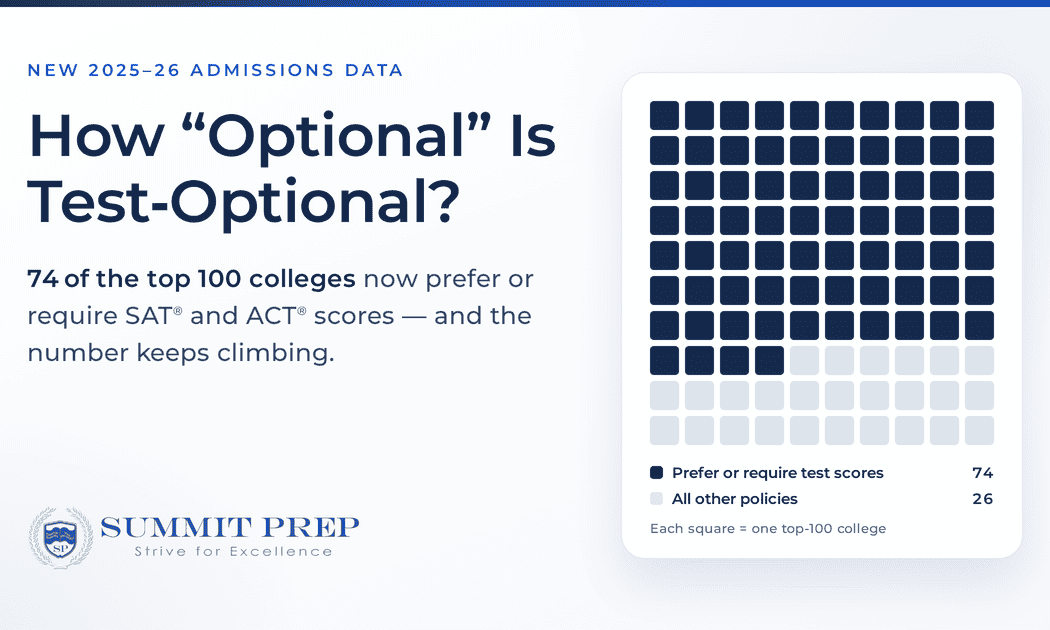
In short, about half became less test-optional. Using historical data as well, 74 of the top 100 colleges are now either test-preferred (40% or more of their students submitted test scores — which essentially guarantees that over 50% of admitted students did so), functionally test-required (defined as 80% or more of their students submitted test scores, so it’s likely only recruited athletes or others with an incredibly strong hook were admitted without them), or test-required for all students.
When nearly three-quarters of the top colleges are test-preferred, functionally test-required, or fully test-required, test-optional starts to look like less of an option. While you may still have the option to apply without test scores, at the vast majority of selective colleges, it’s not an equal option if you actually want to get admitted. And even at truly test-optional colleges, a good SAT or ACT score still helps a student get admitted and earn more merit aid or scholarships. At some test-optional colleges, a named scholarship still requires a score, as our guide to test-optional scholarship requirements shows.
Whether to send a score for the admission decision itself is a separate question; our guide to whether to submit your SAT or ACT scores walks through it.
The sortable table below shows the share of enrolled first-year students who submitted SAT or ACT scores at each of the Forbes Top 100 colleges, drawn from each school’s 2024-25 and 2025-26 Common Data Sets. Click any percentage to open the Common Data Set it comes from, or click a column heading to sort. A dash means the school did not report the figure or has not yet published that year’s data.
| 1 | Massachusetts Institute of Technology | 112% | 114% | Already test-required |
| 2 | Columbia University | 61% | – | Became test-required |
| 3 | Princeton University | 77% | 80% | Became test-required |
| 4 | Stanford University | 69% | 77% | Became test-required |
| 5 | University of California, Berkeley | – | – | Test-blind |
| 6 | Harvard University | 73% | 106% | Became test-required |
| 7 | Williams College | 52% | 61% | Test-preferred, increased |
| 8 | Johns Hopkins University | 68% | 77% | Became test-required |
| 9 | Yale University | 86% | 92% | Became test-required |
| 10 | University of Pennsylvania | 67% | 70% | Became test-required |
| 11 | Vanderbilt University | 52% | 52% | Became test-required |
| 12 | Rice University | 70% | 83% | Functionally test-required, increased |
| 13 | University of Chicago | 76% | 82% | Functionally test-required, increased |
| 14 | Cornell University | – | 56% | Became test-required |
| 15 | University of California, Los Angeles | – | – | Test-blind |
| 16 | Northwestern University | 69% | 73% | Test-preferred, increased |
| 17 | Dartmouth College | – | 102% | Became test-required |
| 18 | Brown University | 85% | 105% | Became test-required |
| 19 | Amherst College | 61% | 61% | Test-preferred, unchanged |
| 20 | University of California, San Diego | – | – | Test-blind |
| 21 | University of Michigan, Ann Arbor | 69% | 73% | Test-preferred, increased |
| 22 | Duke University | 78% | 75% | Test-preferred, decreased |
| 23 | Swarthmore College | 55% | 55% | Test-preferred, unchanged |
| 24 | California Institute of Technology | – | – | Already test-required |
| 25 | Washington University in St. Louis | 57% | 61% | Test-preferred, increased |
| 26 | Claremont McKenna College | 39% | 48% | Became test-required |
| 27 | Emory University | 63% | 68% | Test-preferred, increased |
| 28 | University of Southern California | 42% | 45% | Test-preferred, increased |
| 29 | Wellesley College | 61% | 62% | Test-preferred, increased |
| 30 | University of Florida | 120% | 117% | Already test-required |
| 31 | University of California, Irvine | – | – | Test-blind |
| 32 | Georgia Institute of Technology | 112% | 111% | Already test-required |
| 33 | University of Notre Dame | 59% | 67% | Became test-required |
| 34 | University of Virginia | 59% | 59% | Test-preferred, unchanged |
| 35 | University of North Carolina, Chapel Hill | 69% | 69% | Test-preferred, unchanged |
| 36 | Pomona College | 50% | 49% | Test-preferred, decreased |
| 37 | University of Maryland, College Park | 43% | 44% | Test-preferred, increased |
| 38 | University of Illinois, Urbana-Champaign | 55% | 57% | Test-preferred, increased |
| 39 | Bowdoin College | – | – | Unknown |
| 40 | Brigham Young University | 58% | 54% | Test-preferred, decreased |
| 41 | Georgetown University | 108% | 108% | Already test-required |
| 42 | University of California, Santa Barbara | – | – | Test-blind |
| 43 | Carnegie Mellon University | 75% | 84% | Became test-required |
| 44 | University of California, Davis | – | – | Test-blind |
| 45 | Boston University | 43% | 46% | Test-preferred, increased |
| 46 | University of Texas, Austin | – | – | Became test-required |
| 47 | Washington and Lee University | 44% | 52% | Test-preferred, increased |
| 48 | Colgate University | 37% | 39% | Test-optional, increased |
| 49 | New York University | 38% | 37% | Test-optional, decreased |
| 50 | University of Washington, Seattle | 19% | 24% | Truly test-optional, increased |
| 51 | Wesleyan University | 58% | 59% | Test-preferred, increased |
| 52 | Middlebury College | 46% | 49% | Test-preferred, increased |
| 53 | University of Wisconsin, Madison | 50% | 41% | Test-preferred, decreased |
| 54 | Boston College | 45% | – | Unknown, likely test-preferred |
| 55 | California Polytechnic State University, San Luis Obispo | – | – | Test-blind |
| 56 | Haverford College | 56% | 54% | Test-preferred, decreased |
| 57 | University of Georgia | 116% | 114% | Already test-required |
| 58 | Tufts University | 56% | 58% | Test-preferred, increased |
| 59 | Davidson College | 52% | 50% | Test-preferred, decreased |
| 60 | William & Mary | 59% | 62% | Test-preferred, increased |
| 61 | Texas A&M University, College Station | 90% | 95% | Functionally test-required, increased |
| 62 | Purdue University | 104% | 107% | Already test-required |
| 63 | University of California, Santa Cruz | – | – | Test-blind |
| 64 | Lehigh University | 39% | 43% | Test-preferred, increased |
| 65 | Santa Clara University | 34% | 38% | Test-optional, increased |
| 66 | North Carolina State University, Raleigh | 66% | 53% | Test-preferred, decreased |
| 67 | George Washington University | 39% | 50% | Test-preferred, increased |
| 68 | Binghamton University, SUNY | 53% | 52% | Test-preferred, decreased |
| 69 | University of Rochester | 25% | 22% | Truly test-optional, decreased |
| 70 | Rutgers University | 55% | – | Unknown, likely test-preferred |
| 71 | Colby College | 52% | – | Unknown, likely test-preferred |
| 72 | Florida State University | 100% | – | Already test-required |
| 73 | Hamilton College | 50% | 48% | Test-preferred, decreased |
| 74 | College of the Holy Cross | 45% | – | Unknown, likely test-preferred |
| 75 | Villanova University | 28% | 28% | Truly test-optional, unknown |
| 76 | University of Miami (FL) | 52% | 51% | Became test-required |
| 77 | University of California, Riverside | – | – | Test-blind |
| 78 | University of Minnesota, Twin Cities | 42% | 41% | Test-preferred, decreased |
| 79 | Michigan State University | 60% | 58% | Test-preferred, decreased |
| 80 | Stony Brook University, SUNY | 37% | 42% | Test-preferred, increased |
| 81 | Virginia Tech | 50% | 50% | Test-preferred, unchanged |
| 82 | Trinity University (TX) | 43% | – | Unknown, likely test-preferred |
| 83 | Ohio State University | 64% | 67% | Became test-required |
| 84 | Harvey Mudd College | 68% | 76% | Test-preferred, increased |
| 85 | Bucknell University | 87% | 86% | Functionally test-required, decreased |
| 86 | Clemson University | 55% | – | Unknown, likely test-preferred |
| 87 | San Diego State University | – | – | Test-blind |
| 88 | Trinity College (CT) | 10% | 13% | Truly test-optional, increased |
| 89 | Smith College | 43% | – | Unknown, likely test-preferred |
| 90 | CUNY, Baruch College | 12% | – | Unknown, likely truly test-optional |
| 91 | Lafayette College | 33% | 36% | Test-optional, increased |
| 92 | University of Richmond | 33% | 33% | Test-optional, unchanged |
| 93 | University of Colorado, Boulder | 55% | 33% | Test-optional, decreased |
| 94 | Indiana University, Bloomington | 56% | 58% | Test-preferred, increased |
| 95 | Babson College | – | 28% | Unknown, likely truly test-optional |
| 96 | University of Oklahoma, Norman | 63% | 65% | Test-preferred, increased |
| 97 | California State University, Long Beach | – | – | Test-blind |
| 98 | Wake Forest University | – | – | Unknown |
| 99 | University of Utah | 48% | 50% | Test-preferred, increased |
| 100 | Bates College | 20% | 21% | Truly test-optional, increased |
No colleges match that search.
Submission rates show the share of enrolled first-year students who submitted SAT or ACT scores, as reported in each college’s Common Data Set (section C9) for that admissions cycle. Totals can exceed 100% because students who submit both tests are counted in each figure. Rankings follow the Forbes 2026 Best Colleges list.
Even California is (likely) headed back to test-required
When the University of California campuses return to test-required admissions next year (I am assuming they will, at least for STEM majors, given that over 3,000 of their faculty have signed a letter demanding that they do so), the percentage of top 100 colleges that are test-preferred or test-required will tick up to 82%.
Additionally, the dominoes have almost all fallen in one direction: back to test-required. Since Covid, almost no colleges have gone test-optional or test-blind (Lewis & Clark College, which went test-free starting with its fall 2025 entering class, is a rare exception). And the pace of returning to test-preferred and test-required has quickened, especially regarding the use of AP exam scores in admissions. Even colleges that are enrolling fewer students with test scores might only be doing so out of necessity: too few students submitted test scores to fill a class, so they had to accept students without them. For instance, at the University of Miami, the percentage of enrolled students who submitted test scores declined after the last admissions cycle, yet the college still went back to test-required admissions. Other colleges, too, might feel they are receiving too few applications with test scores, so the only way to fill a class with enough academically prepared students is to return to test-required admissions.
Changes to college admissions
As we discussed in more detail here, verified authenticity is coming to college admissions: SAT and ACT scores are becoming more important, AP exams are increasingly used in admissions decisions, and application essays (which could be written by AI) are declining in importance or are even outright eliminated from the application process of some schools.
Families have caught on. Last year, for the first time since Covid, more applicants submitted test scores to colleges than did not.
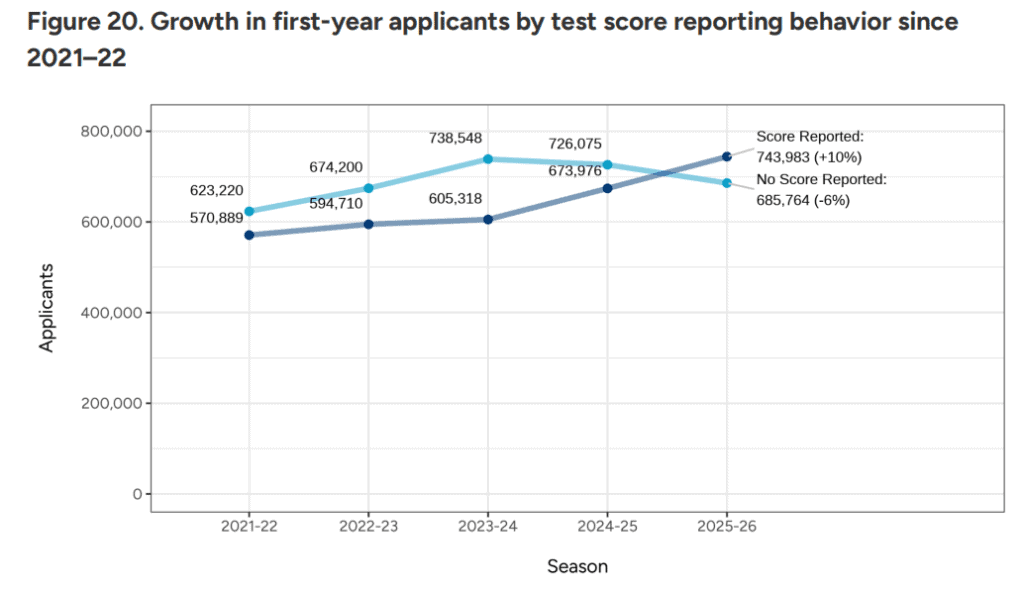
But notice the timing. The Common Data Set covers enrolled students. So the 2025-2026 enrolled students applied in the 2024-2025 admissions cycle. Thus, the shift we are seeing toward test-preferred and test-required admissions started two admissions cycles ago. While the number of test-submitting students has grown every year since Covid, families are operating based on a two-year lag in data between when students apply and when their enrollment information is published in the Common Data Set. That’s not ideal.
Ideally, students and their parents would be in front of the trend, not behind it. To do that, we need to read the room: test-preferred and test-required admissions have only increased, other families are catching on to that fact, and families are best positioned when they act before that fact becomes even more common knowledge.